Orchestration Without the Bloat: Benchmarking 6 Lightweight Alternatives to Airflow
- Data Engineering
- Orchestration
- Python
- MLOps
- DevOps
From 12MB to 1.2GB — a data-driven guide to choosing the right ETL scheduler for your Docker-based MVP.
Originally published on Medium.
Every developer reaches a point in their MVP journey where “simple cron” is no longer enough. You need retries, you need visibility, and you need a way to debug a failed ETL at 3 AM without digging through raw logs.
The industry instinct is often to reach for the “gold standard”: Apache Airflow. But for many projects — especially those running on a single-node VPS or a constrained Docker Compose environment — Airflow isn’t just an orchestrator; it’s an infrastructure tax. When your scheduler consumes more RAM than your actual data processing jobs, it’s time to rethink the stack.
The Problem
I found myself at this crossroads while developing a new platform. I knew I eventually wanted to migrate to k3s, but for the MVP, I needed to keep my overhead low and my deployment simple. I didn’t want to spend my limited budget on a 4GB RAM server just to keep an orchestrator alive. I needed a tool that was:
- Lightweight: Low idle memory and CPU footprint.
- Observable: Real-time log streaming and execution history.
- Portable: A clear path from Docker Compose to Kubernetes.
- Polyglot-ready: I didn’t want to be restricted to a single language — I have to schedule different processes written in Python and Rust.
The Experiment
Instead of guessing, I decided to benchmark the most prominent players in the “lightweight” space against the heavyweights. Using a standardized Python ETL task and a custom benchmarking script, I measured the performance of Ofelia, Supervisord, Cronicle, Kestra, and Airflow.
In this article, I’ll share the raw data from these tests, the “gotchas” of each tool’s logging system, and the “Clean Slate” methodology I used to find the perfect middle ground for my MVP.
The Methodology: A “Clean Slate” Approach
To ensure the data was objective and not skewed by “resource leakage” from previous tests, I followed a strict Clean Slate protocol for every orchestrator.
Environmental isolation
Before each 5-minute benchmark window, a cleanup script was executed to reset the host to a baseline state:
- Container purge:
docker rm -f $(docker ps -aq)to ensure no competing CPU cycles. - Volume & network pruning:
docker system prune --volumes -fto clear cached metadata and bridge networks. - Cold boot: each orchestrator was started from a “cold” state to measure the true initial memory allocation (idle footprint).
The benchmarking engine
I developed a custom benchmark.sh utility (available in the repo) that hooks into the Docker engine. Instead of taking a single snapshot, it polls the docker stats API every 5 seconds. This allowed me to capture not just the “idle” state, but the “burst” behavior when the orchestrator triggers a job.
I measured two specific Key Performance Indicators (KPIs):
- Infrastructure tax (RAM footprint): the “cost of existence” on a cheap VPS, measured at idle and during execution.
- Audit trail & observability: the “3 AM Test” — how easily can we access historical logs for failed jobs?
Reproduce the results
One of my goals for this project was to make it completely reproducible. You shouldn’t have to take my word for it — you can run these exact tests on your own hardware.
I have open-sourced the entire benchmarking suite on GitHub. The repository includes:
- The orchestrator stacks: individual
docker-compose.ymlfiles for all 6 tools, pre-configured for benchmarking. - The benchmarker: the
benchmark.shscript used to collect the raw CSV data. - The analysis suite: the Python scripts (using Pandas and Matplotlib) that generated the charts seen in this article.
Check out the repository here: Link to the code on GitHub. Contributions are welcome!
By following the README.md, you can spin up the same environment, run the benchmarks, and generate your own “Infrastructure Tax” report in less than 15 minutes.
The results: the “price” of orchestration
After running each stack for 5 minutes with a job firing every 60 seconds, the numbers told a dramatic story. I used a logarithmic scale to visualize the results, as the difference between the lightest and heaviest tools spans two orders of magnitude.
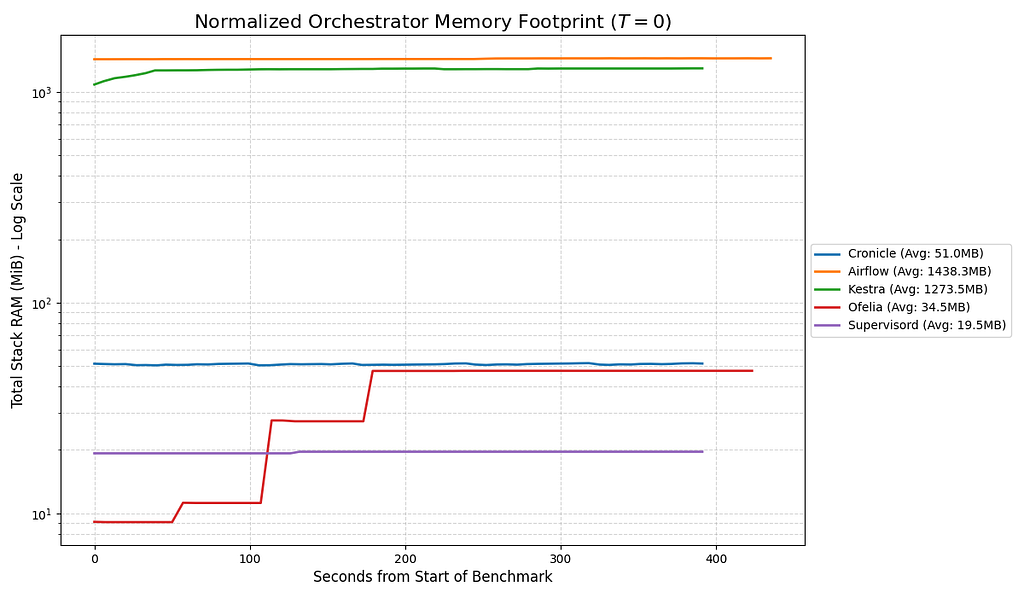
Normalized memory footprint, starting every benchmark at on a logarithmic scale. The lightweight alternatives (Ofelia, Supervisord) are nearly more memory-efficient than the industry standard at idle.
The raw numbers behind that chart:
| Orchestrator | Idle RAM (MiB) | Peak RAM (MiB) | Avg RAM (MiB) | RAM per job (MiB) |
|---|---|---|---|---|
| Supervisord | 19.26 | 19.61 | 19.49 | 3.92 |
| Ofelia | 9.08 | 47.49 | 34.50 | 9.50 |
| Cronicle | 50.40 | 51.64 | 51.03 | 10.33 |
| Kestra | 1085.44 | 1295.36 | 1273.53 | 259.07 |
| Airflow | 1431.42 | 1446.05 | 1438.30 | 289.21 |
Two distinct worlds emerge: the “Lite” world (under 60MB) and the “Enterprise” world (over 1GB). Airflow’s idle and peak usage are nearly identical, which points to a massive, static footprint regardless of the workload.
Final verdict: the cost of over-engineering
The data from this benchmark reveals a stark reality: in the world of orchestration, convenience has a steep price tag. Choosing between these tools isn’t just about features; it’s about a fundamental trade-off between infrastructure tax and operational visibility.
Summary of findings
- The “invisible” tier (Ofelia / Supervisord): if your primary goal is to save every possible megabyte on a $5/month VPS, these are your winners. At under 20MB average RAM, they are virtually non-existent on your system monitor. However, you pay the price in “hidden” technical debt — debugging a failure requires manual log diving and a deep knowledge of the underlying host.
- The “MVP I care about the cost” zone (Cronicle): for most MVPs, Cronicle is the standout discovery. It provides a professional-grade web UI, retries, and execution history for a modest 51MB footprint — the perfect middle ground, giving you the observability of a heavyweight at roughly 3% of the resource cost.
- The “enterprise” heavyweights (Airflow / Kestra): Airflow and Kestra are undeniably powerful, but they’re resource hogs for an early-stage project. With a 1GB+ “entry fee,” they’re best reserved for complex, multi-team environments where DAG dependencies are a major pain point. If you must choose a heavyweight for a modern stack, Kestra’s polyglot-first architecture gives it the edge over Airflow’s Python-centric monolith.
My recommendation
If you’re building an MVP on Docker Compose today with an eye toward k3s tomorrow:
- Start with Cronicle if you want to sleep soundly knowing you can check job statuses from your phone without crashing your server.
- Stick with Ofelia if you’re a “terminal-first” developer who treats RAM like gold.
- Avoid Airflow or Kestra until your “RAM tax” is no longer a significant percentage of your monthly burn.
What’s next?
Orchestration is a journey, not a destination. As the platform grows and moves toward a full Kubernetes cluster, the heavyweights may eventually earn their keep. But for now, the priority is spending resources on users, not on the scheduler.
Acknowledgments
A huge thank you to the r/mlops subreddit for being the sounding board for this project. The original discussion sparked the “Clean Slate” methodology used here and pushed me to look beyond the industry giants toward more efficient, Docker-native alternatives. You can find the original thread and the community’s early feedback here.